
Designing Your First Data Product: Why Analytics Engineering Starts Before SQL
From Raw Data to Business Data Products (part 7)
By this point in the project, I had built a modern analytics platform.
The raw Airbnb data was stored in Snowflake.
The staging models standardized the source data.
Intermediate models encapsulated reusable business logic.
Dimensions represented stable business entities.
From a technical perspective, the warehouse was in good shape.
But I still hadn't answered a simple question:
What am I actually building for the business?
That question changed how I approached the rest of the project.
Until now, every model I created existed to support the architecture.
From this point forward, every model would exist to support a business decision.
That shift is what introduced me to one of the most important concepts in analytics engineering:
A data product is designed before it is built.
The Mistake I Almost Made
When I first decided to build Host360, my instinct was to open VS Code and start writing SQL.
After all, I already had the warehouse.
I already had the data.
Surely the next step was implementation.
Looking back, that would have been a mistake.
Professional analytics engineering projects rarely begin with SQL.
They begin with questions.
Before writing a single query, I needed to understand what problem I was trying to solve.
Start With the Business, Not the Database
Imagine you're an analytics engineer at Airbnb.
One morning, someone from the Product team walks over and says:
"We need a complete view of every host."
Notice what they didn't ask for.
They didn't ask for:
- A dbt model
- A Snowflake table
- A SQL query
- A dashboard
They asked for information.
This is an important distinction.
Business users don't think in terms of warehouse models.
They think in terms of decisions.
As analytics engineers, our responsibility is to translate those business questions into trusted, reusable data products.
Step 1: Define the Grain
The first design decision has nothing to do with SQL.
It is simply answering one question:
What does one row represent?
For Host360, the answer is straightforward.
One row = One host
Every metric that appears in the final dataset must describe that single host.
This sounds obvious, but it's one of the most important modeling decisions you'll make.
Without a clearly defined grain, it's impossible to build consistent metrics.
Step 2: Identify the Consumers
The next question is:
Who will use this data product?
Different teams care about different things.
For Host360, I imagined several consumers.
Product Team
They might ask:
- Which hosts consistently provide excellent guest experiences?
- Which hosts should receive new platform features first?
Operations Team
They might ask:
- Which hosts have declining occupancy?
- Which hosts require additional support?
Marketing Team
They might ask:
- Which hosts should be invited into a premium host program?
- Which hosts should receive promotional campaigns?
Data Science Team
They might use Host360 as a feature set for models that predict:
- Superhost eligibility
- Booking likelihood
- Host churn
- Revenue potential
Notice that every team is asking different questions.
Yet they all need information about the same business entity.
That is exactly why a unified data product becomes valuable.
Step 3: Translate Questions Into Metrics
At this point, I still wasn't thinking about SQL.
Instead, I started mapping business questions to business metrics.
For example:
| Business Question | Required Metric |
|---|---|
| How many properties does this host manage? | Listing Count |
| Does this host provide quality experiences? | Average Rating |
| How active is this host? | Review Count |
| How successful are the listings? | Occupancy Rate |
| How available are the listings? | Available Days / Booked Days |
Once I completed this exercise, something interesting happened.
The columns for Host360 practically designed themselves.
Instead of randomly selecting fields from source tables, every column now had a clear purpose.
Step 4: Group Related Information
Rather than creating one long list of unrelated columns, I organized the data into logical business sections.
Identity
Who is this host?
- Host ID
- Host Name
- Location
- Superhost Status
- Identity Verification
Portfolio
What does this host manage?
- Listing Count
- Average Bedrooms
- Average Bathrooms
- Average Guest Capacity
Quality
How well do guests rate this host?
- Average Rating
- Cleanliness
- Accuracy
- Location
- Value
- Review Count
Availability
How active are the host's listings?
- Available Days
- Booked Days
- Occupancy Rate
- Average Minimum Nights
Notice that these groups mirror the way people naturally think about a host.
They're not organized around source systems.
They're organized around business understanding.
Step 5: Design the Architecture
Only after defining the business questions did I think about implementation.
Once the required metrics were identified, the architecture almost designed itself.
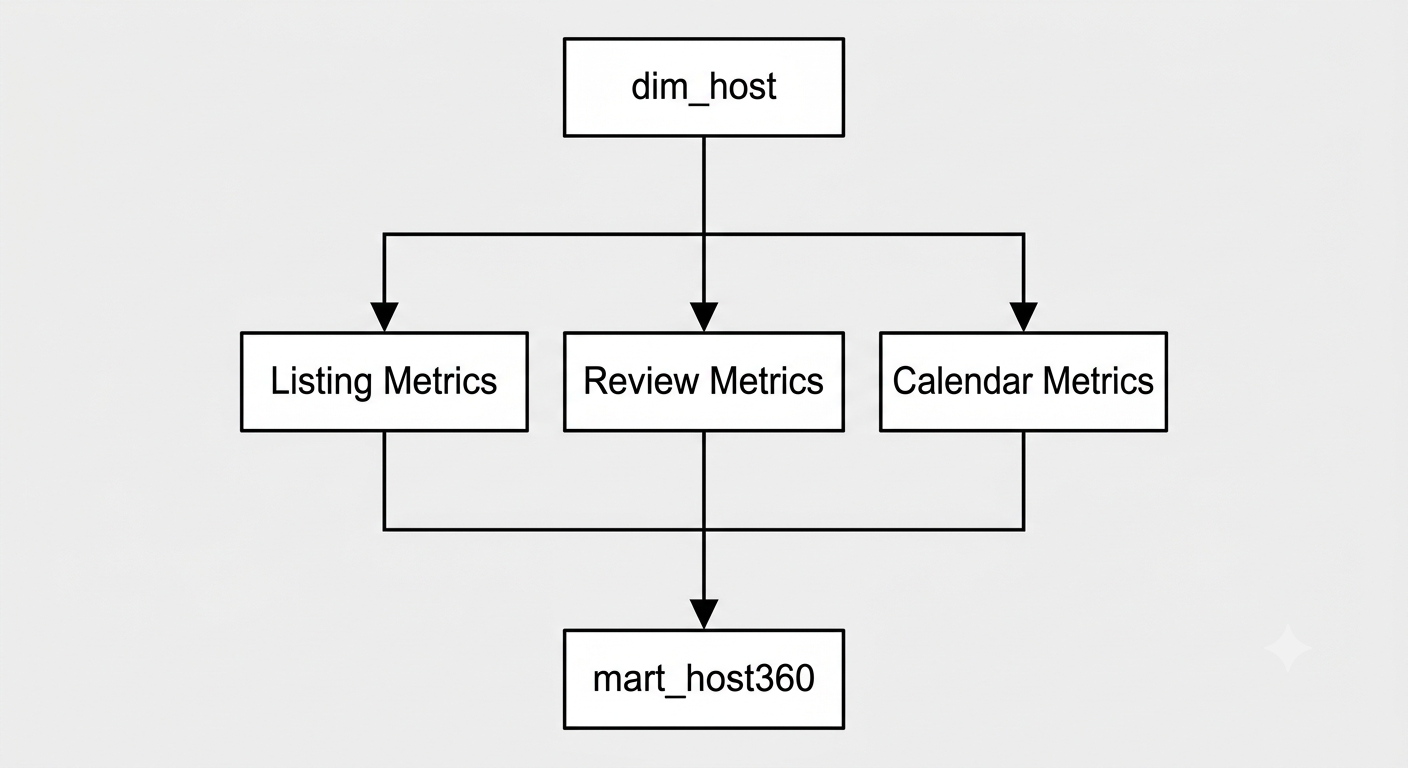
This diagram immediately answered several implementation questions.
Where should host identity come from?
The host dimension.
Where should occupancy be calculated?
The calendar intermediate model.
Where should review metrics live?
The review intermediate model.
By the time I reached this stage, the SQL was already planned.
Step 6: Write a Design Document
One lesson I learned from software engineering is that implementation becomes much easier when the design is written first.
Before creating Host360, I could have created a simple design document like this:
# Host360

## Grain

One row per host.

## Consumers

- Product
- Marketing
- Operations
- Data Science

## Business Questions

- Which hosts perform best?
- Which hosts have declining occupancy?
- Which hosts should join a premium program?

## Required Metrics

- Listing Count
- Average Rating
- Review Count
- Occupancy Rate
- Available Days
- Booked Days

## Source Models

- dim_host
- int_host_listing_metrics
- int_host_review_metrics
- int_host_calendar_metrics

## Output

mart_host360
This document contains almost no technical implementation.
Yet it answers one of the most important questions in analytics engineering:
What problem is this data product solving?
Many experienced analytics teams create lightweight design documents like this before writing SQL because they help everyone agree on the purpose of the model before discussing implementation details.
The Biggest Lesson I Learned
Before this project, I assumed analytics engineering was mostly about transforming data.
Now I think about it differently.
Analytics engineering is really about designing information.
The SQL is simply one way of implementing that design.
If the business questions aren't clear, even perfectly written SQL won't produce a useful data product.
Conversely, once the design is well thought out, writing the SQL becomes surprisingly straightforward.
Looking Ahead
Now that Host360 has been fully designed, it's time to build it.
In the next article, we'll implement the model in dbt by combining the host dimension with the reusable metrics we've already created in our intermediate layer.
One of the biggest surprises you'll notice is how simple the final SQL becomes.
That's not because the problem is simple.
It's because the architecture has already done the hard work.