
Building Listing360: Reusing Design Patterns to Scale Analytics Engineering
One of the biggest lessons I learned while building this project was that good analytics engineering isn't about creating unique models.
It's about creating repeatable patterns.
By the time I finished building Host360, I realized something surprising.
I wasn't actually finished building the platform.
I had only solved the problem for one business entity.
Airbnb doesn't only care about hosts.
It also cares about listings.
Questions like these are asked every day:
- Which listings have the highest occupancy?
- Which listings consistently receive poor reviews?
- Which property types perform best?
- Which neighborhoods are improving?
- Which listings should appear higher in search results?
Although these questions are different from the ones answered by Host360, the architecture to answer them is almost identical.
That realization changed how I thought about analytics engineering.
Instead of designing another solution, I simply reused the same pattern.
Start With the Business Again
Just like Host360, Listing360 did not begin with SQL.
It began with one simple question.
What does the business want to know about a listing?
Everything else followed naturally.
Step 1: Define the Grain
The first decision was exactly the same.
What does one row represent?
One row = One listing
This immediately defines the scope of every metric.
Nothing in Listing360 should describe multiple listings.
Everything should answer questions about one specific property.
Step 2: Define the Consumers
Unlike Host360, Listing360 serves a slightly different audience.
Product Team
Questions include:
- Which listings are improving?
- Which listings should receive better visibility?
Search Team
Questions include:
- Which listings should rank higher?
- Which listings consistently satisfy guests?
Operations Team
Questions include:
- Which listings need attention?
- Which properties have declining occupancy?
Marketing Team
Questions include:
- Which listings should be promoted?
- Which neighborhoods deserve targeted campaigns?
Data Science Team
Listing360 also becomes an excellent feature table for machine learning.
Possible prediction problems include:
- Occupancy forecasting
- Rating prediction
- Booking likelihood
- Listing quality classification
Notice something important.
Every consumer is different.
But they all need information about exactly one listing.
Step 3: Translate Business Questions Into Metrics
Just like Host360, the next step wasn't choosing SQL.
It was choosing metrics.
The business questions naturally grouped themselves into several categories.
Identity
Who is this listing?
- Listing ID
- Host ID
- Listing Name
- Property Type
- Room Type
- Neighborhood
Capacity
How large is the property?
- Accommodates
- Bedrooms
- Bathrooms
- Beds
Quality
How satisfied are guests?
- Average Rating
- Cleanliness
- Accuracy
- Communication
- Location
- Value
Activity
How much engagement does the listing receive?
- Review Count
- Latest Review
- Reviews Per Month
Availability
How frequently is the listing booked?
- Available Days
- Booked Days
- Occupancy Rate
- Minimum Nights
Again, every metric exists because it answers a business question.
Not because it happened to exist in the source data.
Step 4: The Architecture Designs Itself
Once the business questions were clear, the implementation became almost obvious.
The architecture closely mirrors Host360.
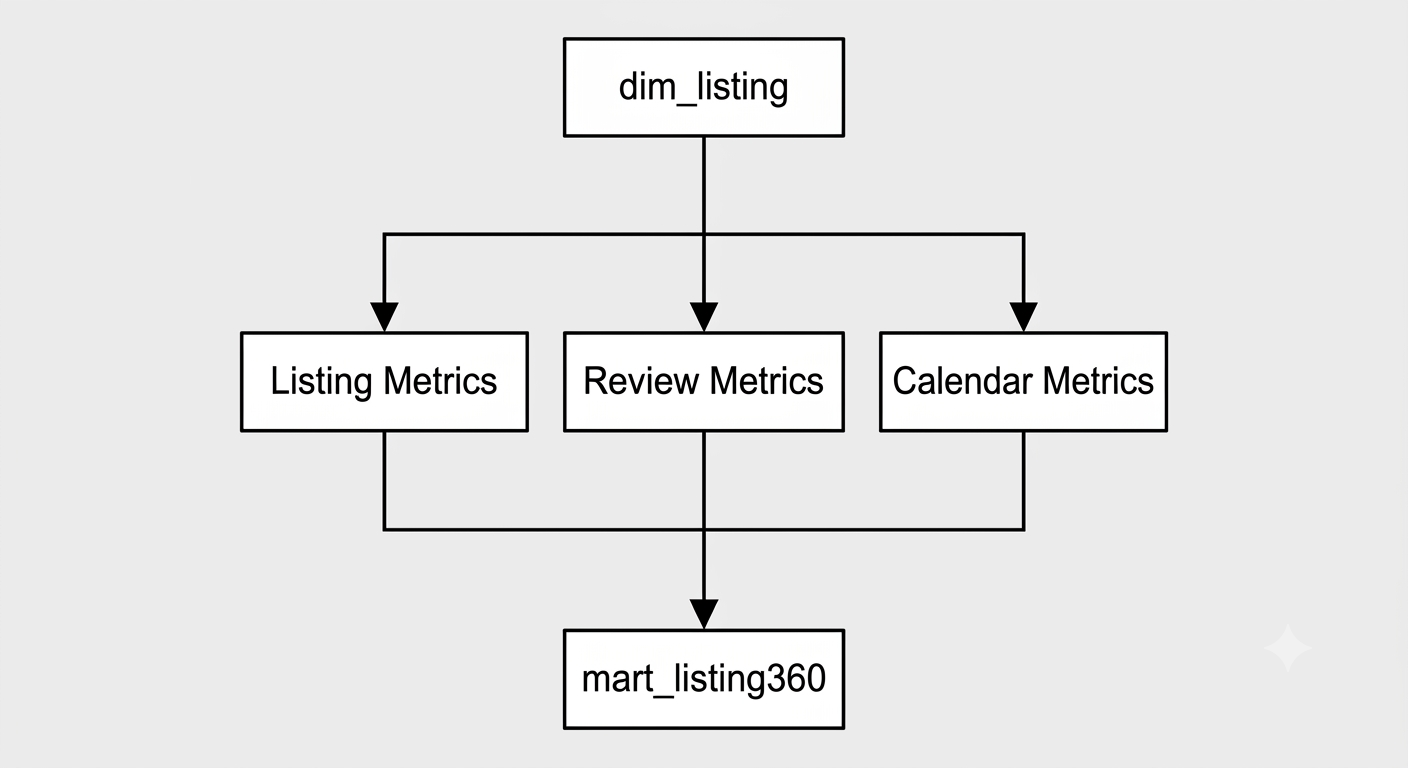
This was one of my favorite moments in the project.
I wasn't inventing another architecture.
I was applying a proven one.
That's exactly how mature analytics engineering teams scale.
Building Listing360
Because the intermediate models already contained the business logic, the final implementation remained remarkably simple.
The mart starts from the listing dimension.
Each intermediate model contributes one specific category of business metrics.
The final SQL is primarily responsible for assembling those pieces into a unified business view.
Just like Host360, Listing360 performs very little computation itself.
Most of the complexity has already been handled upstream.
That isn't accidental.
It's a deliberate design choice.
Keeping calculations inside reusable intermediate models allows multiple downstream data products to rely on the same trusted definitions.
Why Repeating the Pattern Matters
One realization surprised me while building Listing360.
The difficult part wasn't writing SQL.
The difficult part had already been solved.
Once the architectural pattern existed, building another 360 model became a matter of following the same workflow.
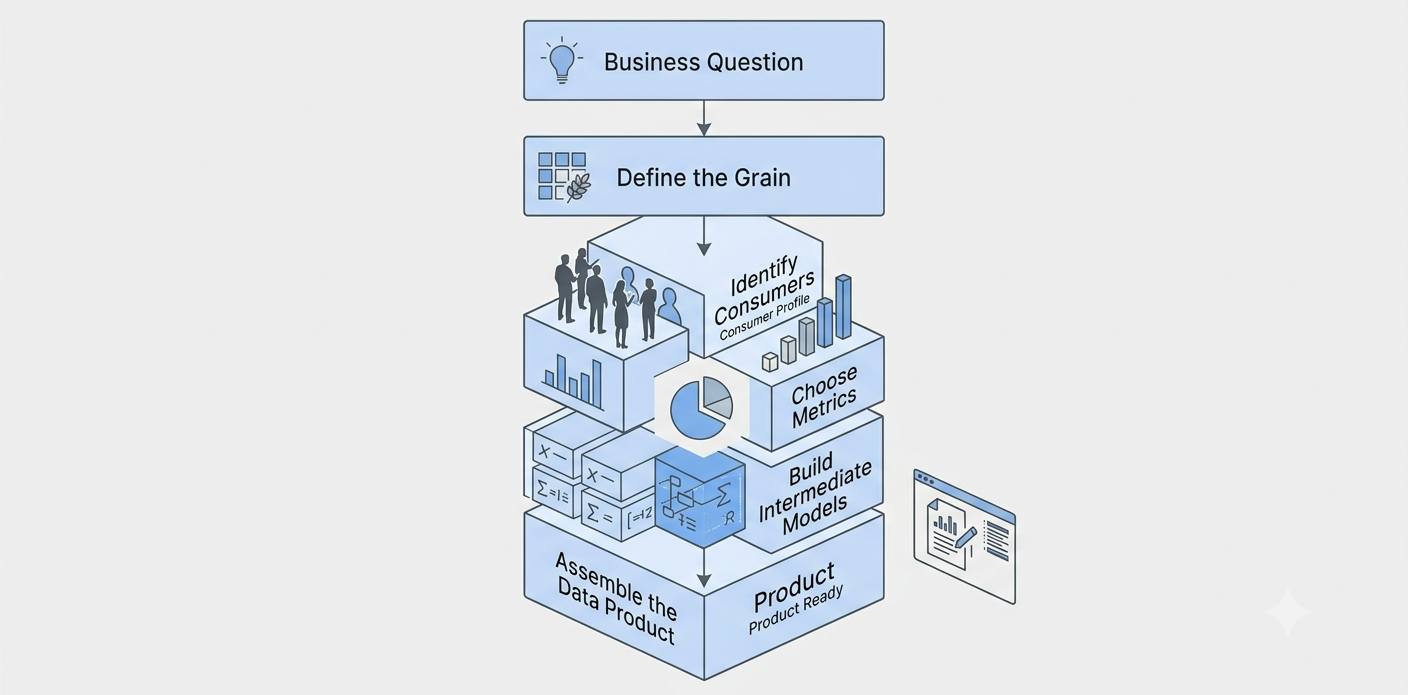
This repeatable process is far more valuable than memorizing individual dbt models.
It provides a framework that can be applied to almost any analytics problem.
Beyond Airbnb
While working on this project, I couldn't help thinking about how this same architecture appears in many industries.
An e-commerce company might build Product360.
A healthcare organization might build Patient360.
A university might build Student360.
A credit union might build Member360.
The business entities change.
The architecture does not.
Once you learn how to organize data around business entities rather than source systems, the same design pattern becomes reusable across domains.
What We've Built So Far
At this point, the Airbnb project contains two complete business data products.
Host360 organizes everything known about a host.
Listing360 organizes everything known about a listing.
Neither model was designed around tables.
Neither model was designed around SQL.
Both were designed around business questions.
That's the biggest shift in thinking this project has given me.
Analytics engineering is not about building warehouse models.
It's about creating reliable information products that help people make better decisions.
Looking Ahead
With Host360 and Listing360 complete, we now have trusted business views for our two most important entities.
The next logical step is to move beyond individual entities and answer questions at a higher level.
In the next article, we'll build our first executive data product: a Neighborhood Summary mart.
Instead of asking, "How is one host performing?" or "How is one listing performing?", we'll answer questions like:
- Which neighborhoods are growing?
- Which areas have the highest occupancy?
- Where are guest ratings improving?
- Which markets deserve additional investment?
This is where analytics engineering begins supporting strategic decision-making across the business.