
From Entity360 to Executive Dashboards: Building a Neighborhood Summary Mart
By the time I finished building Host360 and Listing360, I had created two complete business data products.
Each one answered questions about a single business entity.
Host360 helped us understand hosts.
Listing360 helped us understand listings.
At first, I thought the project was complete.
But then I asked myself another question.
Would an executive ever query Host360 directly?
Probably not.
Executives rarely ask questions about individual listings or individual hosts.
Instead, they ask questions like:
- Which neighborhoods are performing the best?
- Which markets are attracting the most listings?
- Which areas receive the highest guest ratings?
- Where should we invest more marketing resources?
- Which neighborhoods require operational attention?
These questions aren't about individual entities.
They're about groups of entities.
This is where executive data products begin.
A Different Kind of Consumer
Throughout this series, we've designed data products around operational users.
Marketing teams.
Operations teams.
Product managers.
Data scientists.
Now our audience changes.
Imagine presenting Airbnb's quarterly performance to leadership.
No executive wants to scroll through fifty thousand listings.
They want summaries.
They want trends.
They want KPIs.
The purpose of analytics changes.
Instead of describing one listing, we're now describing an entire neighborhood.
Reusing the Data Products We Already Built
One of the biggest advantages of analytics engineering is that higher-level models don't need to start from raw data.
In fact, they shouldn't.
Every layer in the architecture exists to make the next layer simpler.
Instead of joining raw listings, reviews, and calendar tables again, we simply reuse the trusted Listing360 data product.
The architecture now looks like this:
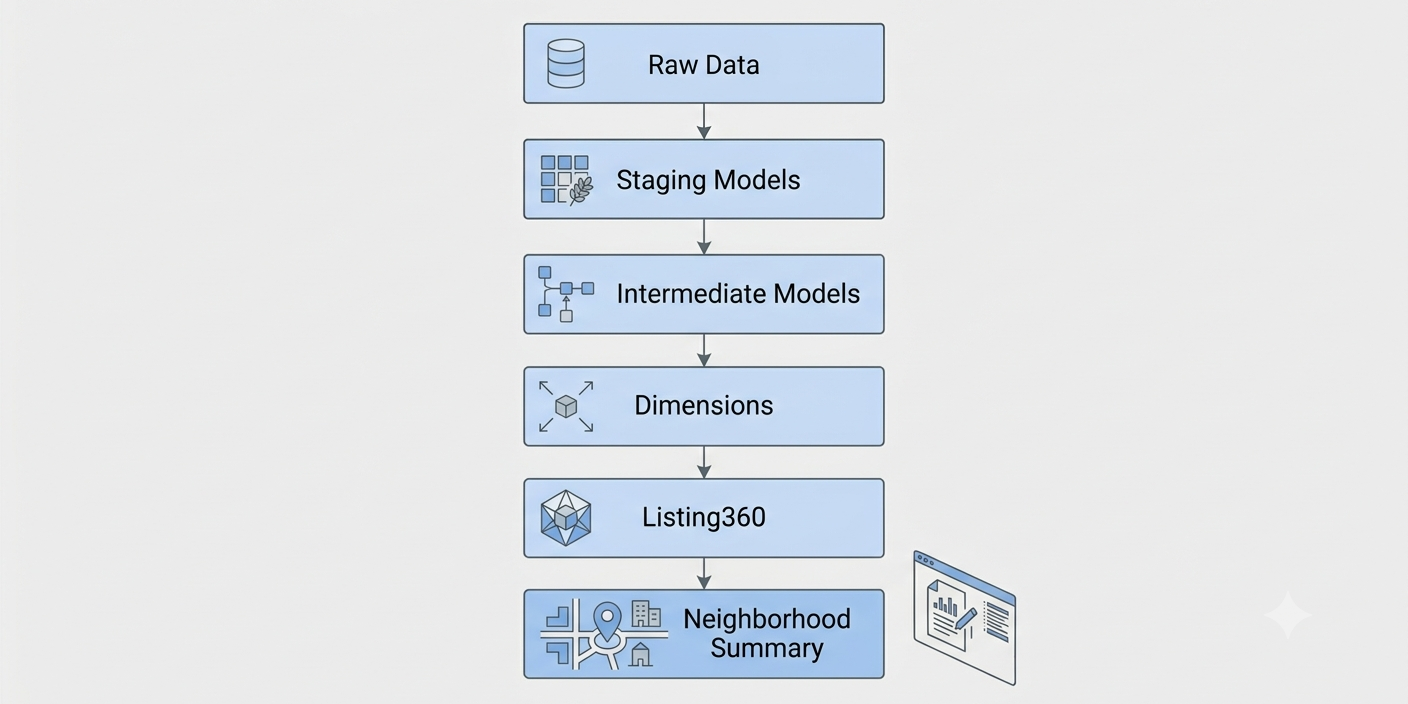
Notice something important.
Every new layer becomes simpler than the one before it.
That's the opposite of what I expected when I first started learning analytics engineering.
Building the Neighborhood Summary
Because Listing360 already contains the metrics we need, the implementation becomes remarkably small.
with listings as (

    select *
    from {{ ref('mart_listings_360') }}

),

neighborhood_summary as (

    select

        neighborhood,

        count(distinct listing_id) as listings_count,

        count(distinct host_id) as host_count,

        avg(avg_rating) as avg_rating,

        sum(review_count) as review_count

    from listings

    group by neighborhood

)

select *
from neighborhood_summary
At first glance, this query almost feels too simple.
That's actually a good sign.
The simplicity isn't because the business problem is easy.
It's because we've already invested the effort to create reusable data products.
Why Start From Listing360 Instead of the Raw Tables?
When I first wrote this model, I asked myself a question.
Why not join the raw tables again?
After all, I already know where the data comes from.
The answer is consistency.
Listing360 already defines:
- Average rating
- Review count
- Listing identity
- Neighborhood
- Host relationship
If another team builds a dashboard tomorrow, they will use the exact same metric definitions.
No duplicated SQL.
No inconsistent calculations.
No competing versions of the truth.
This is one of the biggest benefits of layered analytics engineering.
Every new model builds on trusted work that already exists.
Executive Data Products Should Be Simple
One lesson surprised me during this project.
The closer you get to the business, the simpler the SQL becomes.
Raw ingestion is complicated.
Cleaning messy source systems is complicated.
Business metric calculations are complicated.
Executive summaries should not be.
If an executive mart requires hundreds of lines of SQL, that's often a sign that too much business logic is leaking into the final layer.
Instead, the executive layer should primarily answer questions through aggregation.
That's exactly what this model does.
It summarizes trusted listing metrics by neighborhood.
Nothing more.
Nothing less.
What Can the Business Do With This?
Although the model contains only a few columns, it answers several meaningful business questions.
A product manager might ask:
- Which neighborhoods have the highest average ratings?
An operations manager might ask:
- Which neighborhoods have the largest number of active hosts?
Marketing could ask:
- Which neighborhoods deserve promotional campaigns?
Leadership could ask:
- Which markets are growing faster than others?
The interesting part is that every team is using the same data product.
Only the questions change.
The Beginning of Executive Analytics
This neighborhood summary is more than another dbt model.
It's the beginning of an executive analytics layer.
Once this pattern exists, creating additional summaries becomes straightforward.
For example, we could build:
- Property Type Summary
- Room Type Summary
- Host Performance Summary
- Monthly Performance Summary
- City Summary
Each model would follow the same architecture.
Rather than returning one row per listing, they would aggregate trusted business metrics around a higher-level business concept.
Looking Beyond Airbnb
As I worked on this project, I started seeing this architecture everywhere.
In a credit union, this model might become a Branch Summary.
Instead of neighborhoods, the grouping could be branches.
Instead of listings, the aggregation would summarize members.
Instead of review counts, it might calculate product adoption or loan balances.
The entity changes.
The architecture remains remarkably similar.
That's one of the most valuable lessons analytics engineering has taught me.
Good architectures are reusable.
Looking Ahead
We've now built the complete analytics stack for this project.
We started with raw CSV files stored in Amazon S3.
We loaded them into Snowflake.
We cleaned and standardized the data with dbt.
We created reusable intermediate models.
We designed business data products like Host360 and Listing360.
Finally, we built an executive summary that turns thousands of individual records into information leadership can use.
In the final article of this series, I'll reflect on the biggest lessons I learned throughout this journey from thinking in terms of tables to thinking in terms of business decisions and how this project completely changed my understanding of analytics engineering.